Data in Grasshopper
Distributing data
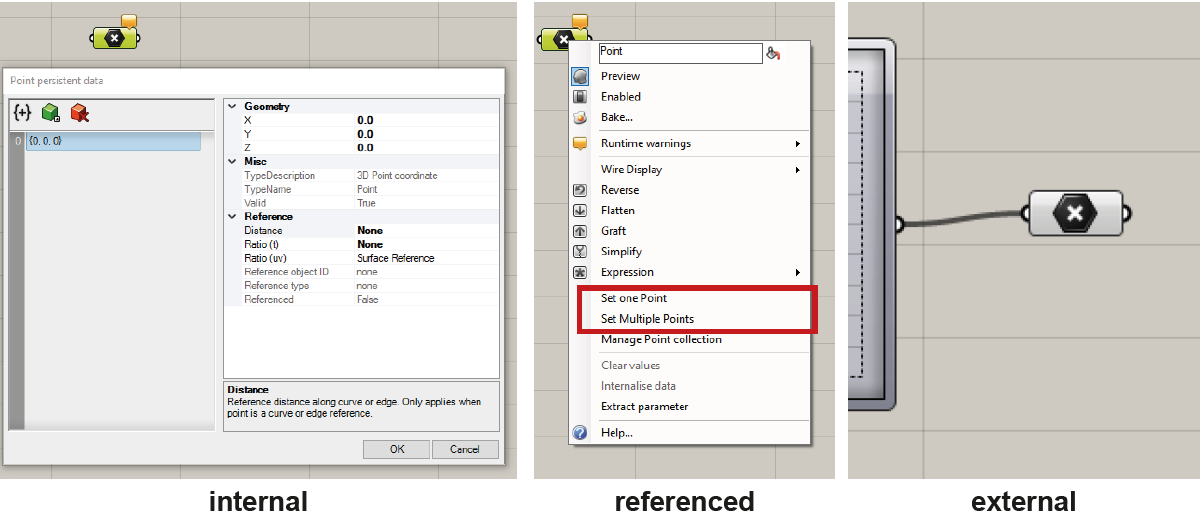
Data can be distributed to components in three different ways: internally, referenced (right click on the component), or externally from the output of another component.
Note: A primary distinction between internalised data and referenced data pertains to their storage locations. Internal data are stored within the Grasshopper file, saved in the .gh format. Conversely, referenced data are housed in the Rhino file, saved in the .3dm format.
Data Management
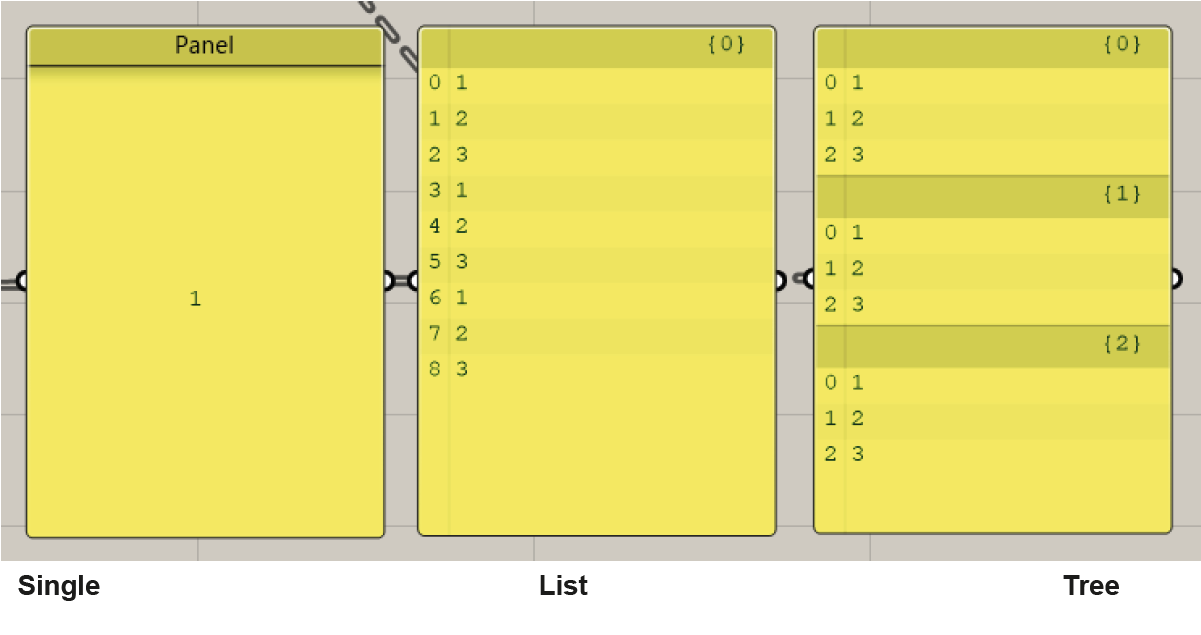
Data in Grasshopper is managed in three different ways:
- A single data item
- A list of items
- A "data tree" (a list of lists that contain items)
List
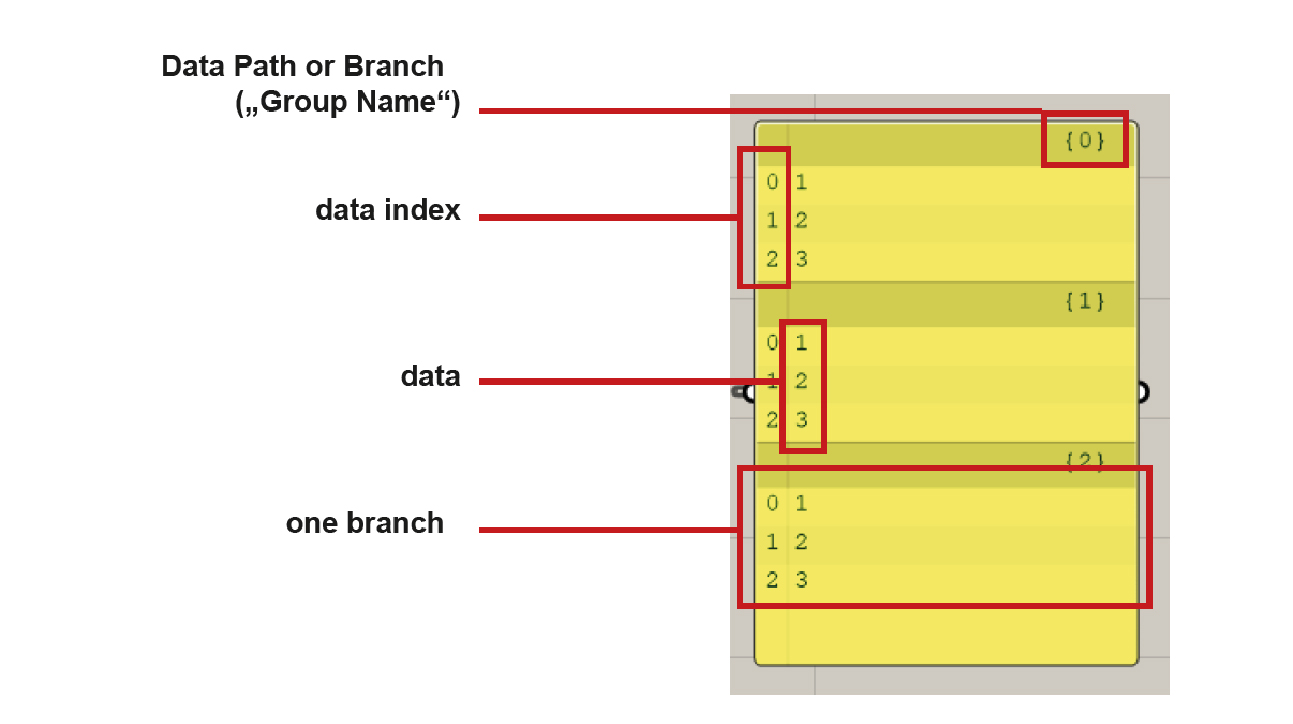
Lists store your data and organize several data items. Each data item has its index that refers to its position inside the list. (Notably, indexing starts from
0instead of1.) An item can be any data known to Grasshopper, such as a file, a line, a point, color information etc. Data items can also be empty (Nullobject).Lists can be manipulated using components in the
Sets > Listpanel. For example, you can split list with theSplit Listcomponent, get the list length byList Length, access specific item in the list throughList Item, etc. An overview of list operations in Grasshopper can be found here.
Data-Tree
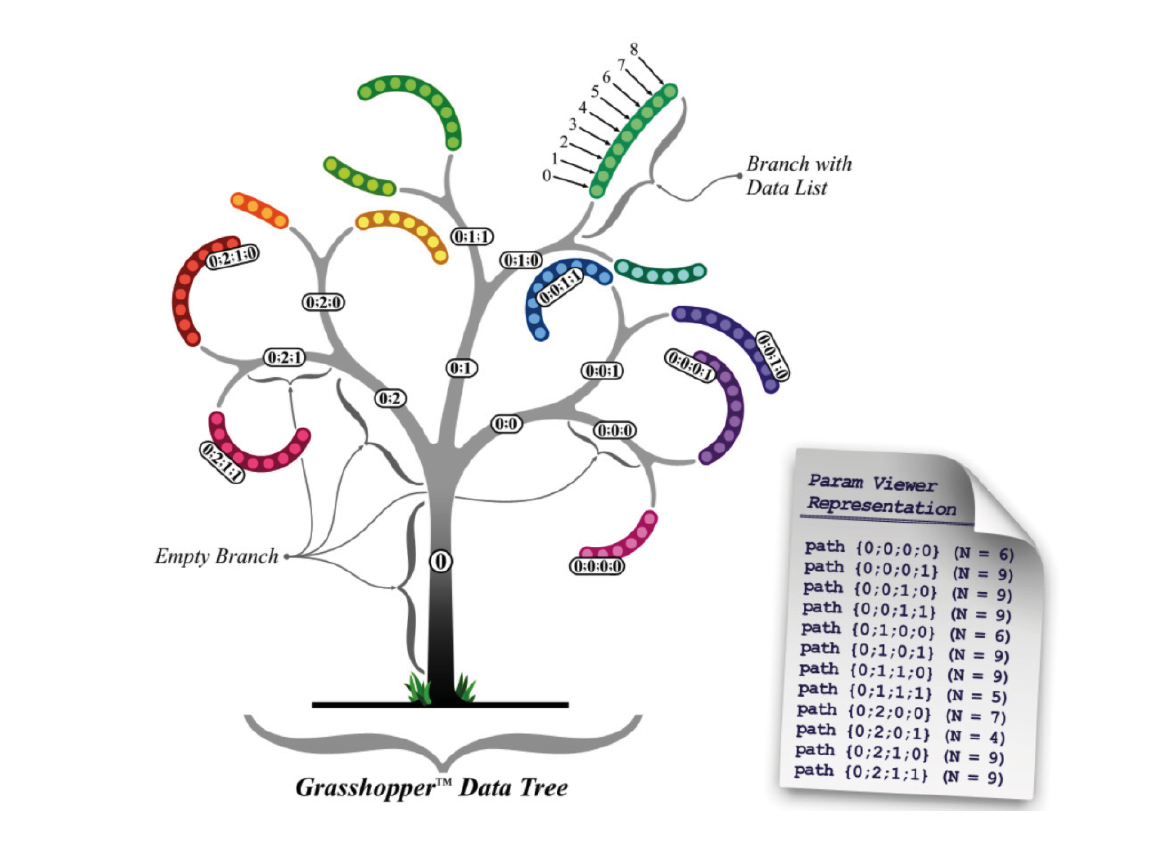
Some components create an output of multiple lists. They are stored in so called data trees. Functioning like a folder structure on your computer, data trees operate as lists within lists, potentially varying significantly in complexity.
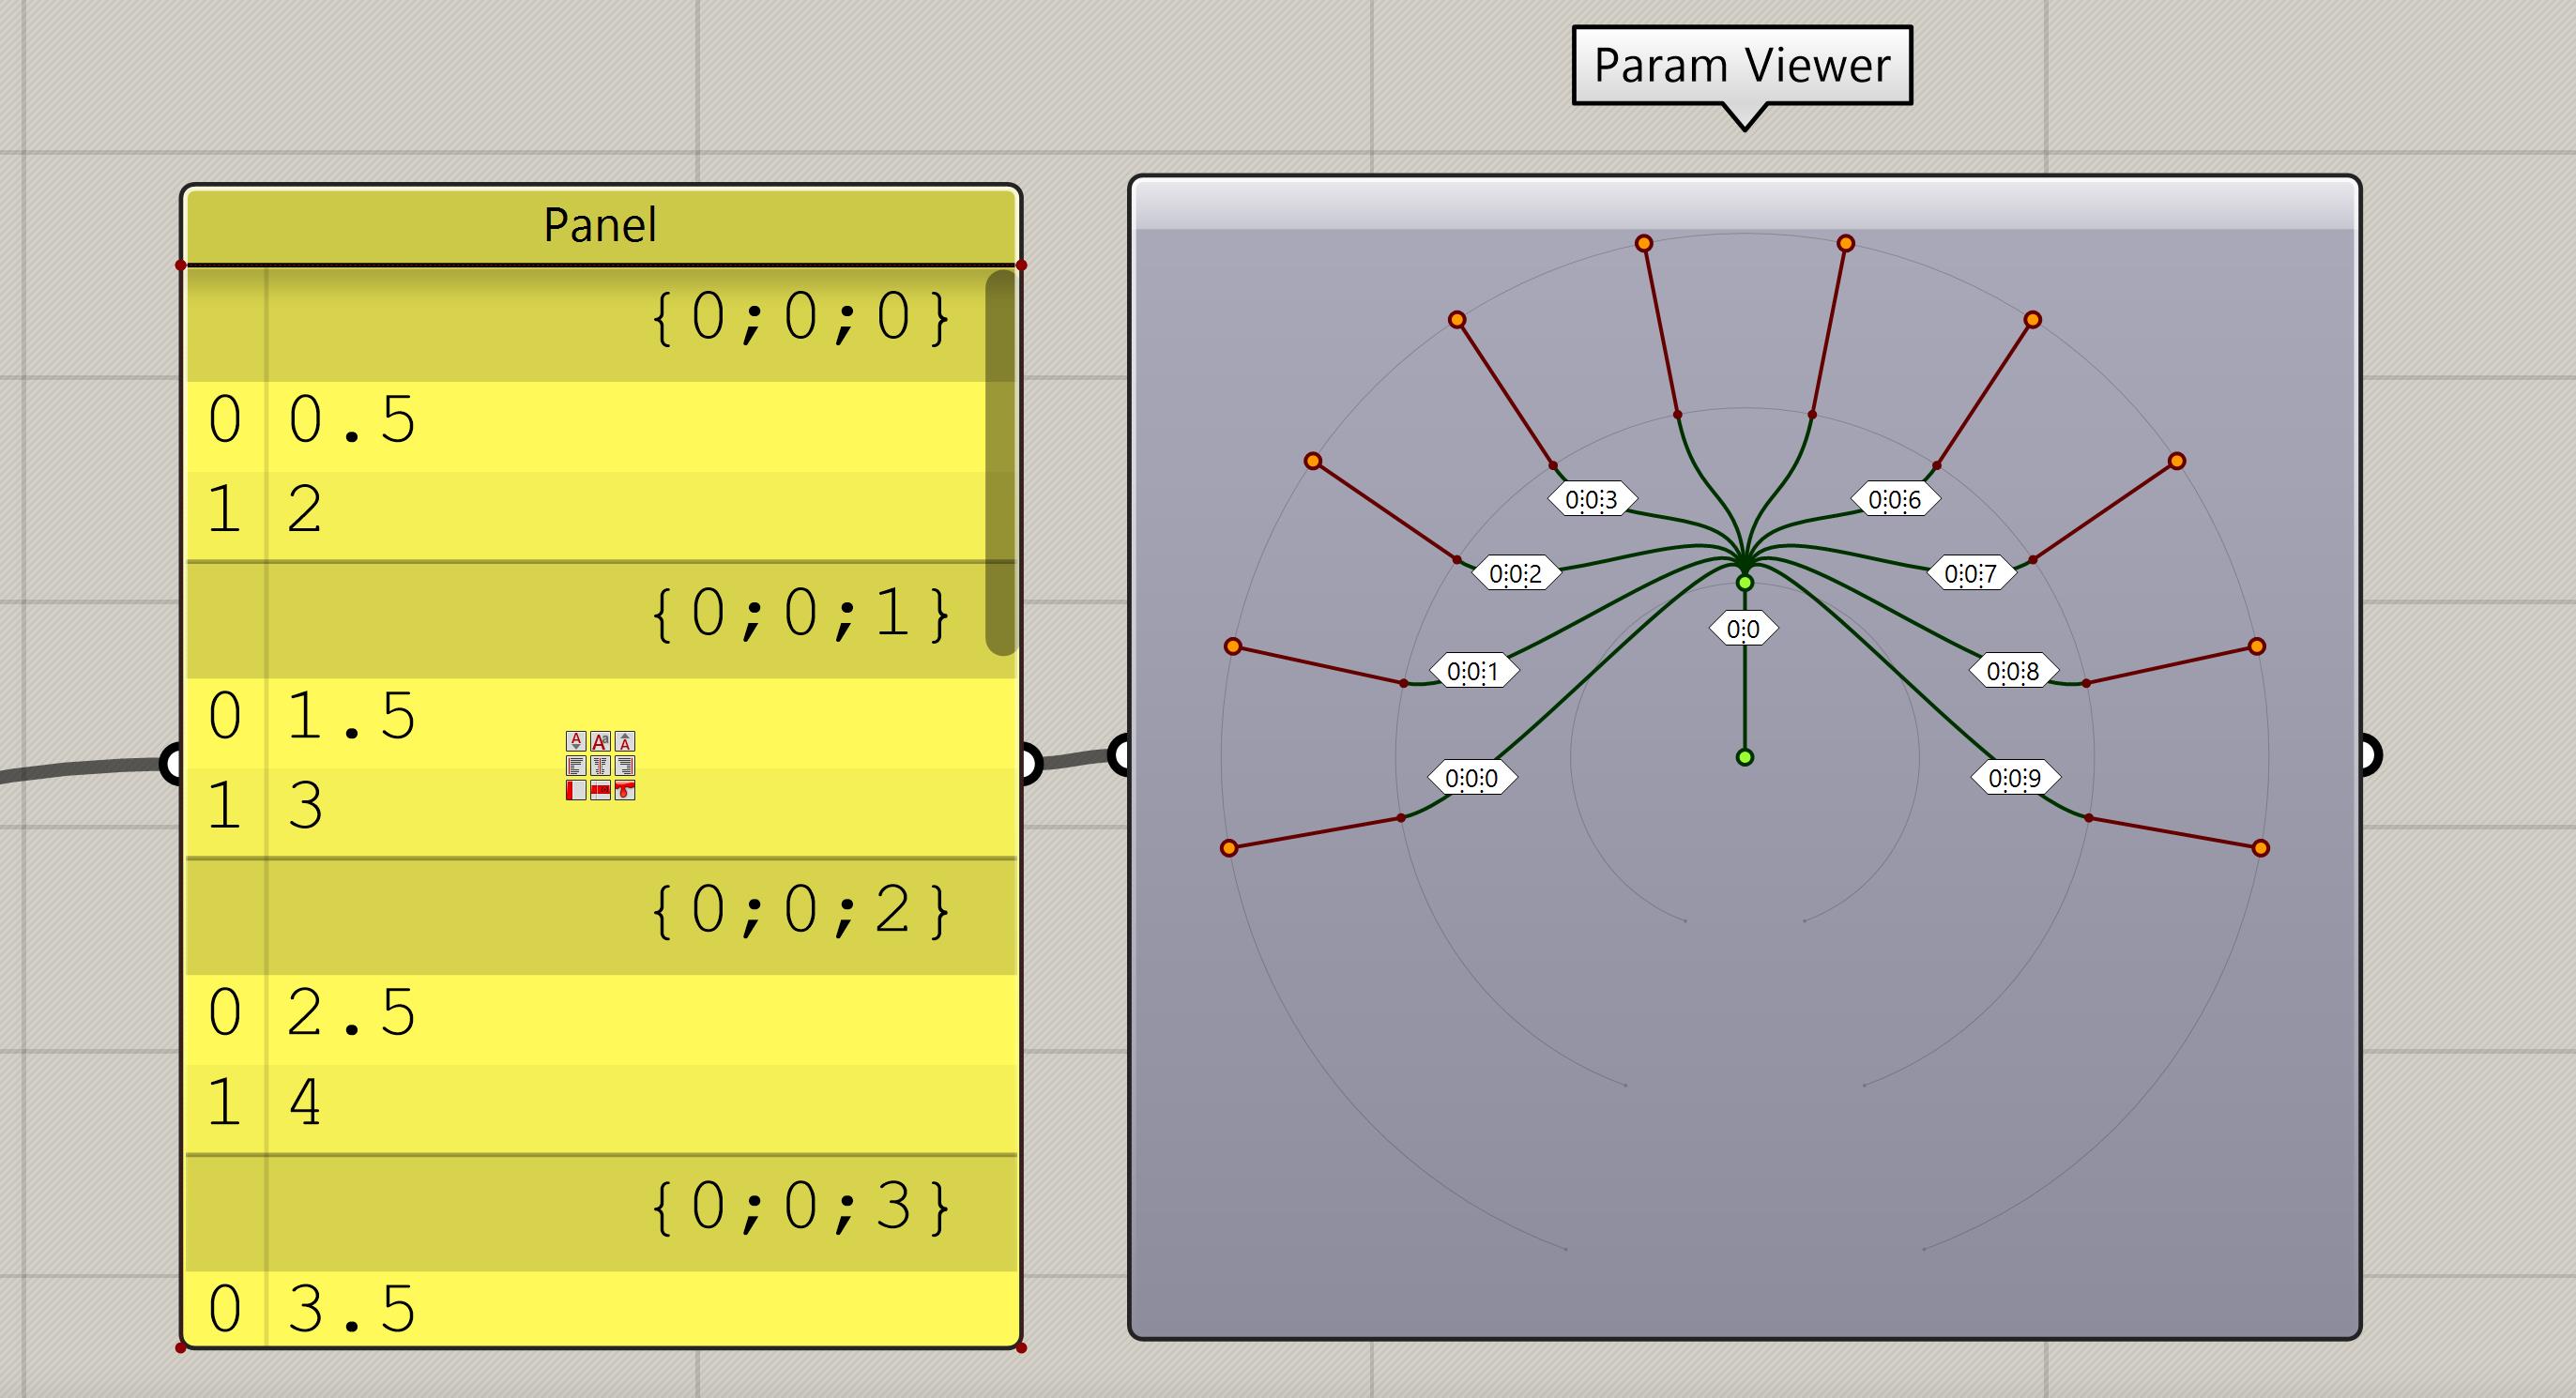
Data tree can be visulized with the
Param Viewercomponent. The image above shows data tree with one main branch{0;0}. Stemming from this main branch are nine sub-branches, each labeled sequentially according to their parent branch; the first sub-branch is identified as{0;0;0}, followed by the second,{0;0;1}, and so forth. This naming convention allows a clear understanding of each data point's location within the tree structure.
Component Data IO
By right-clicking on the input or output sides of a component, you can choose different
options to manipulate the data stream. The main options are Reverse, Flatten, Graft,
Simplify and Expression.
Reverse
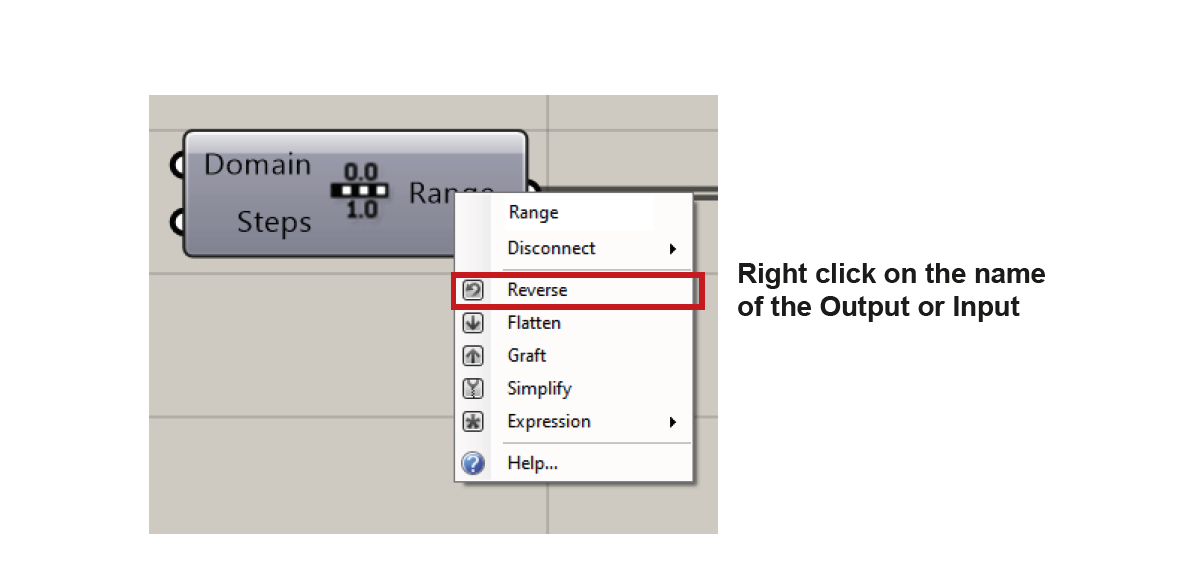
By activating the
Reversefunction either on the input or the output, it will reverse the order of the items. (See example below.)
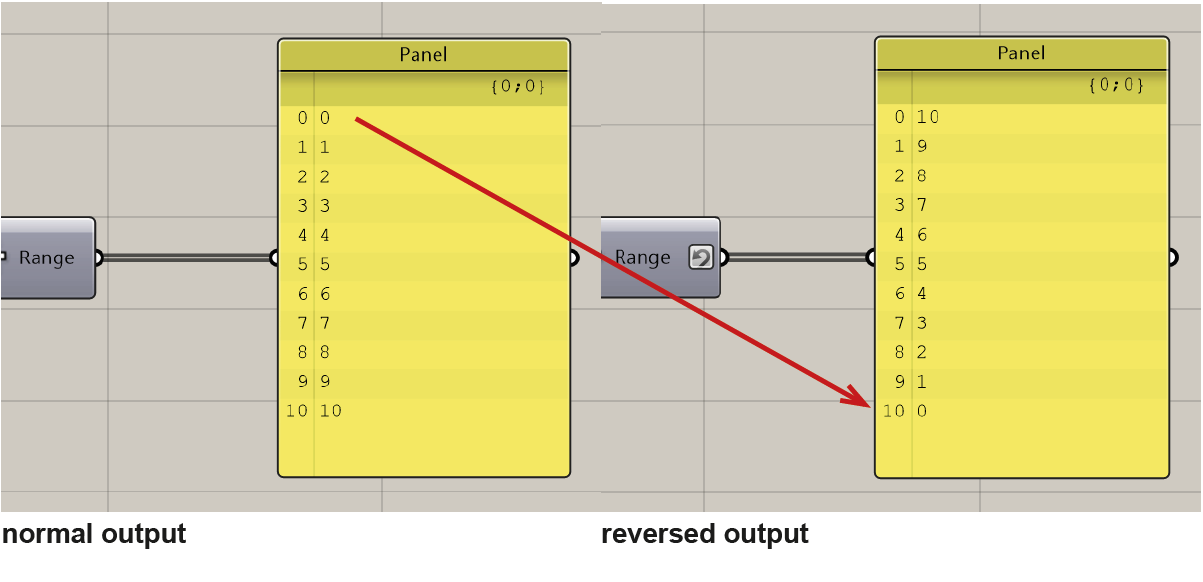
Following the
Reverseoperation, the item originally at index0moves to index10, while the one previously at index10takes the position at index0.
Graft / Flatten
To grasp the workings of these two function, it is pivotal to understand how Grasshopper handles and organizes data. As mentioned above, each data tree has one or multiple branches where a list of items are stored. Instead of manipulating the items in the list, Graft and Flatten manipulate the branches. Graft introduces a new level of possible branches, while Flatten performs the inverse, reducing a data tree's complexity by collapsing to one single branch.
We can use the following example to get more intuition of these two functions:
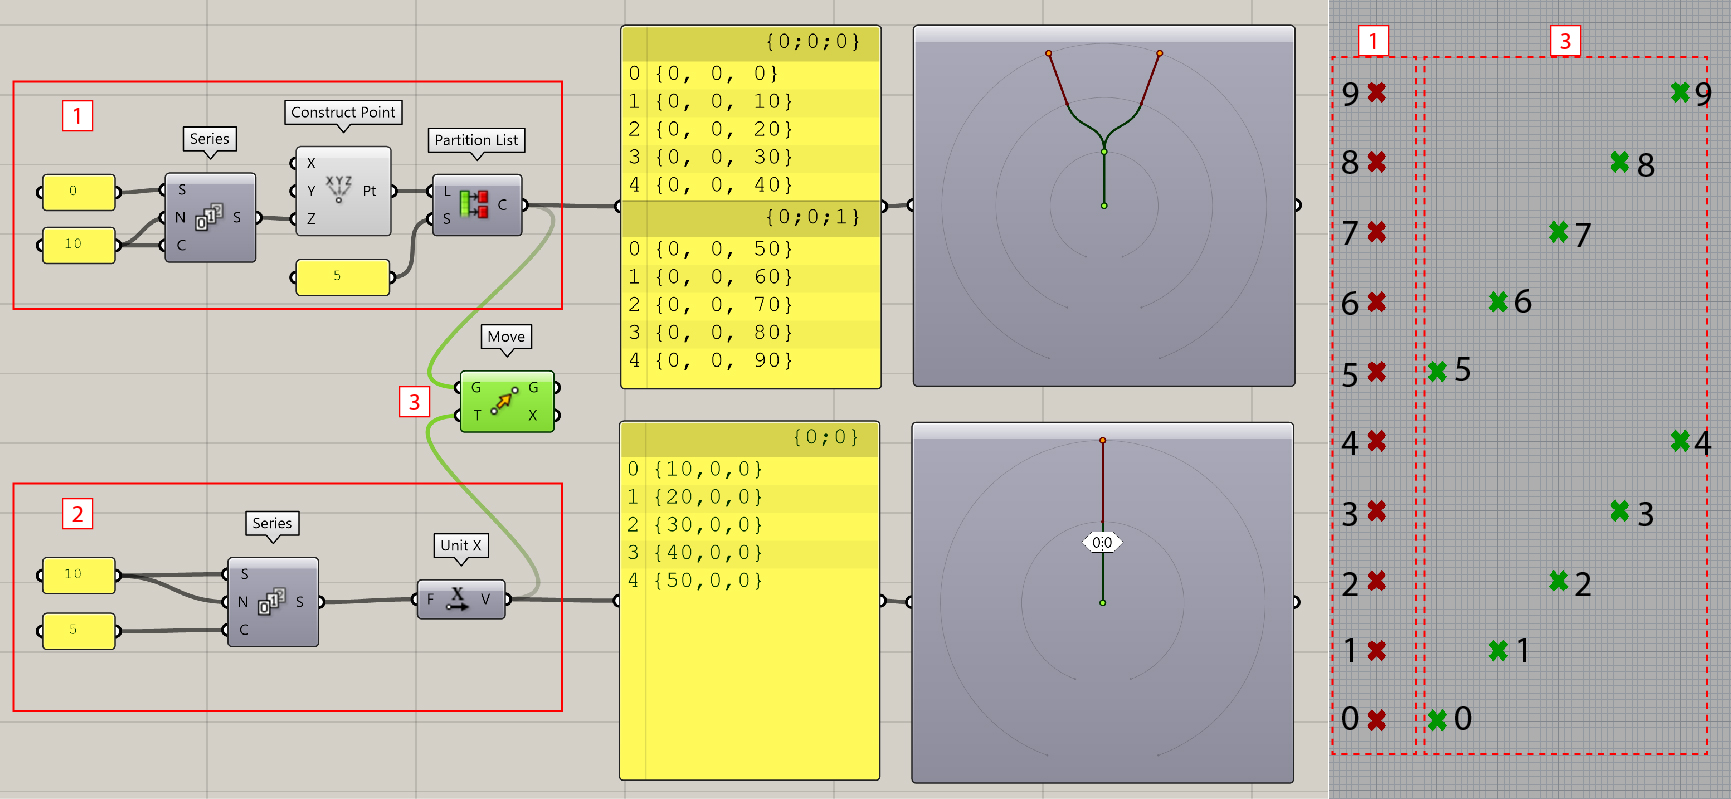
- Create ten evenly spaced points along the Z-axis, each separated by a distance of 10 units. For illustrative purposes, we partition these ten points into two branches. These points are depicted in red in the image on the right-hand side.
- Establish a series of movement directions along the X-axis, following the sequence: 10, 20, 30, 40, 50. Notice all these directional values are contained within the same branch.
- Use the
Movecomponent to associate the defined points with the respective movement directions. The resultant points are illustrated in green in the image on the right-hand side. Note that the move operations are applied item-wise within each branch.
The next step is to Graft or Flatten the data points. To do this, right-click on the output side of Partition Listcomponent and select corresponding options. We will see how the points shift as a result of these manipulations.
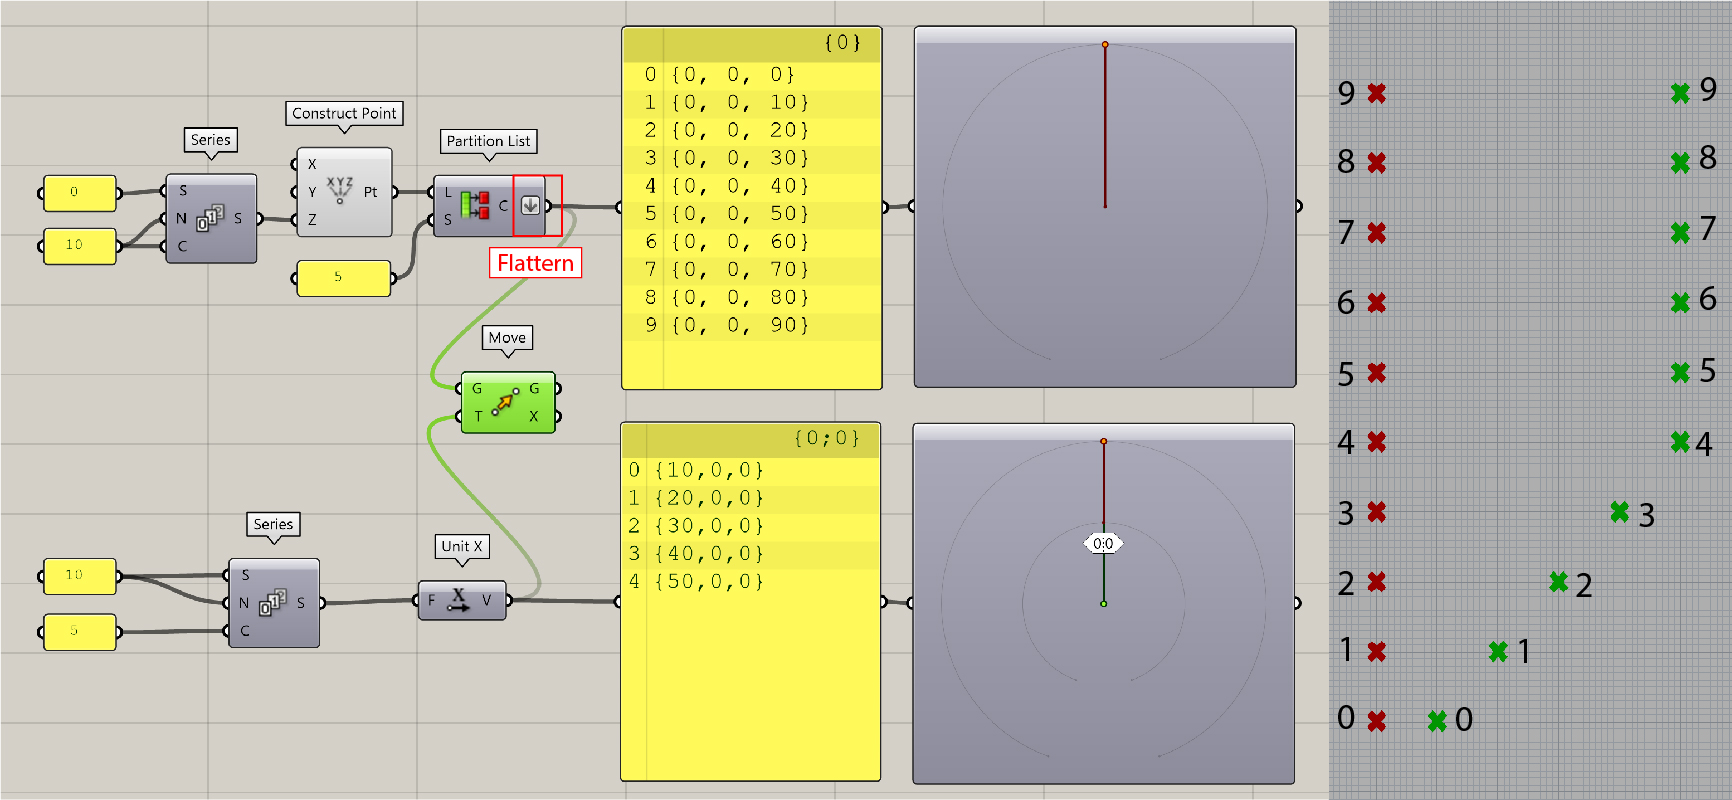
After
Flatten, the data tree only consists of one branch{0}and all the data points are in the same branch. The resultant points are highlighted in green in the image on the right-hand side. The move operations are applied item-wise to the first five points, whereas the last five points each move 50 units along the X-direction.
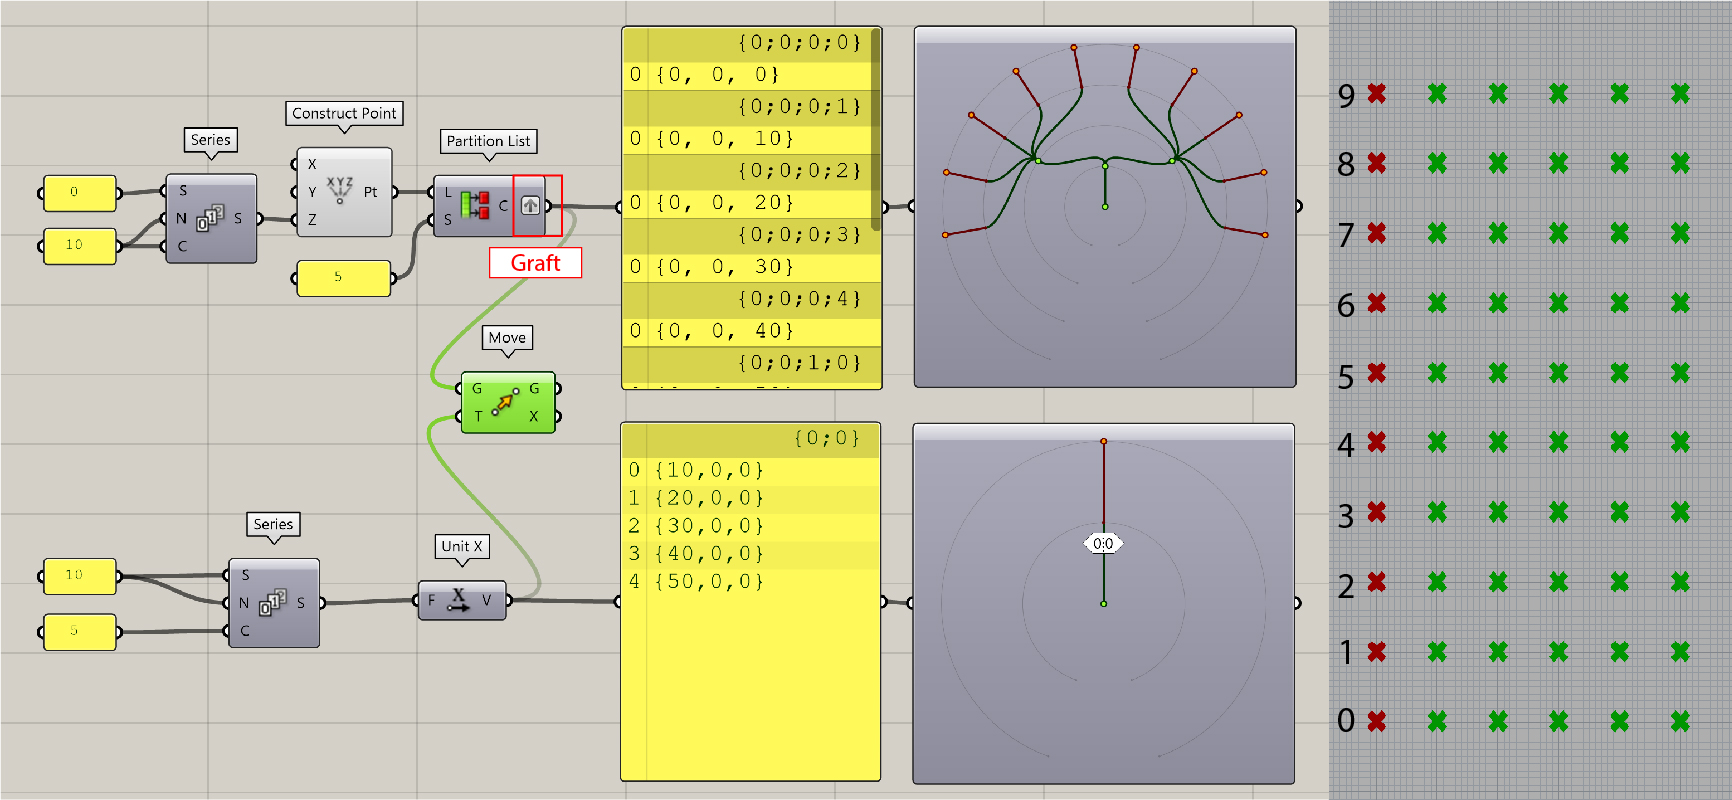
Graftputs every point into a seperate branch (or sub-list). The first branch is denoted with the index{0;0;0;0}, followed sequentially by{0;0;0;1}, and so on." This affects the data structure for further manipulation. We can see now the five move operations are applied on each point, which results in fifty points.
To summarize our observations, the manipulation process involving two data-trees unfolds in a two-step procedure:
- First, the branches of each tree are paired off in segments. In instances where one tree has fewer branches, the final branch from the shorter tree is paired with the remaining branches from the other tree.
- Following the branch pairing, the individual items within those matched branches are similarly paired off in segments. Should one branch house fewer items, the last item in that branch is used to pair up with any additional items in its counterpart branch.
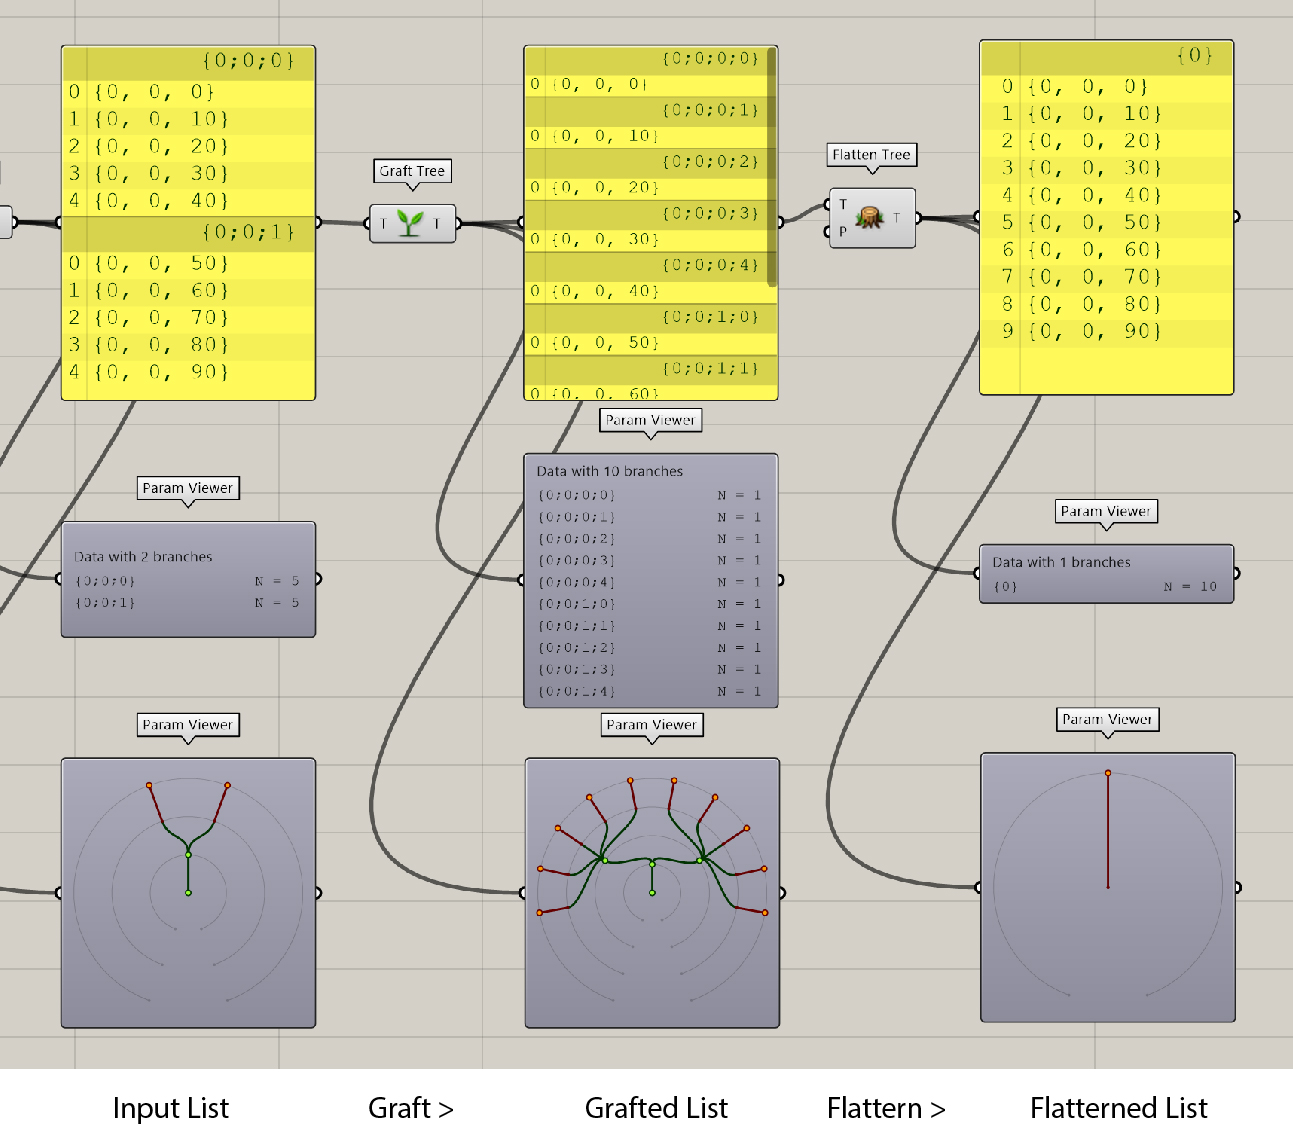
An overview with all steps from
GrafttoFlattena list. Note we can also use the components likeGraft TreeandFlatten Treeto achieve graft and flatten functions, respectively.
Simplify
Simplify allows you to collapse all empty branches, thereby reducing the data tree to its minimum necessary complexity while preserving the integrity of the data structure.
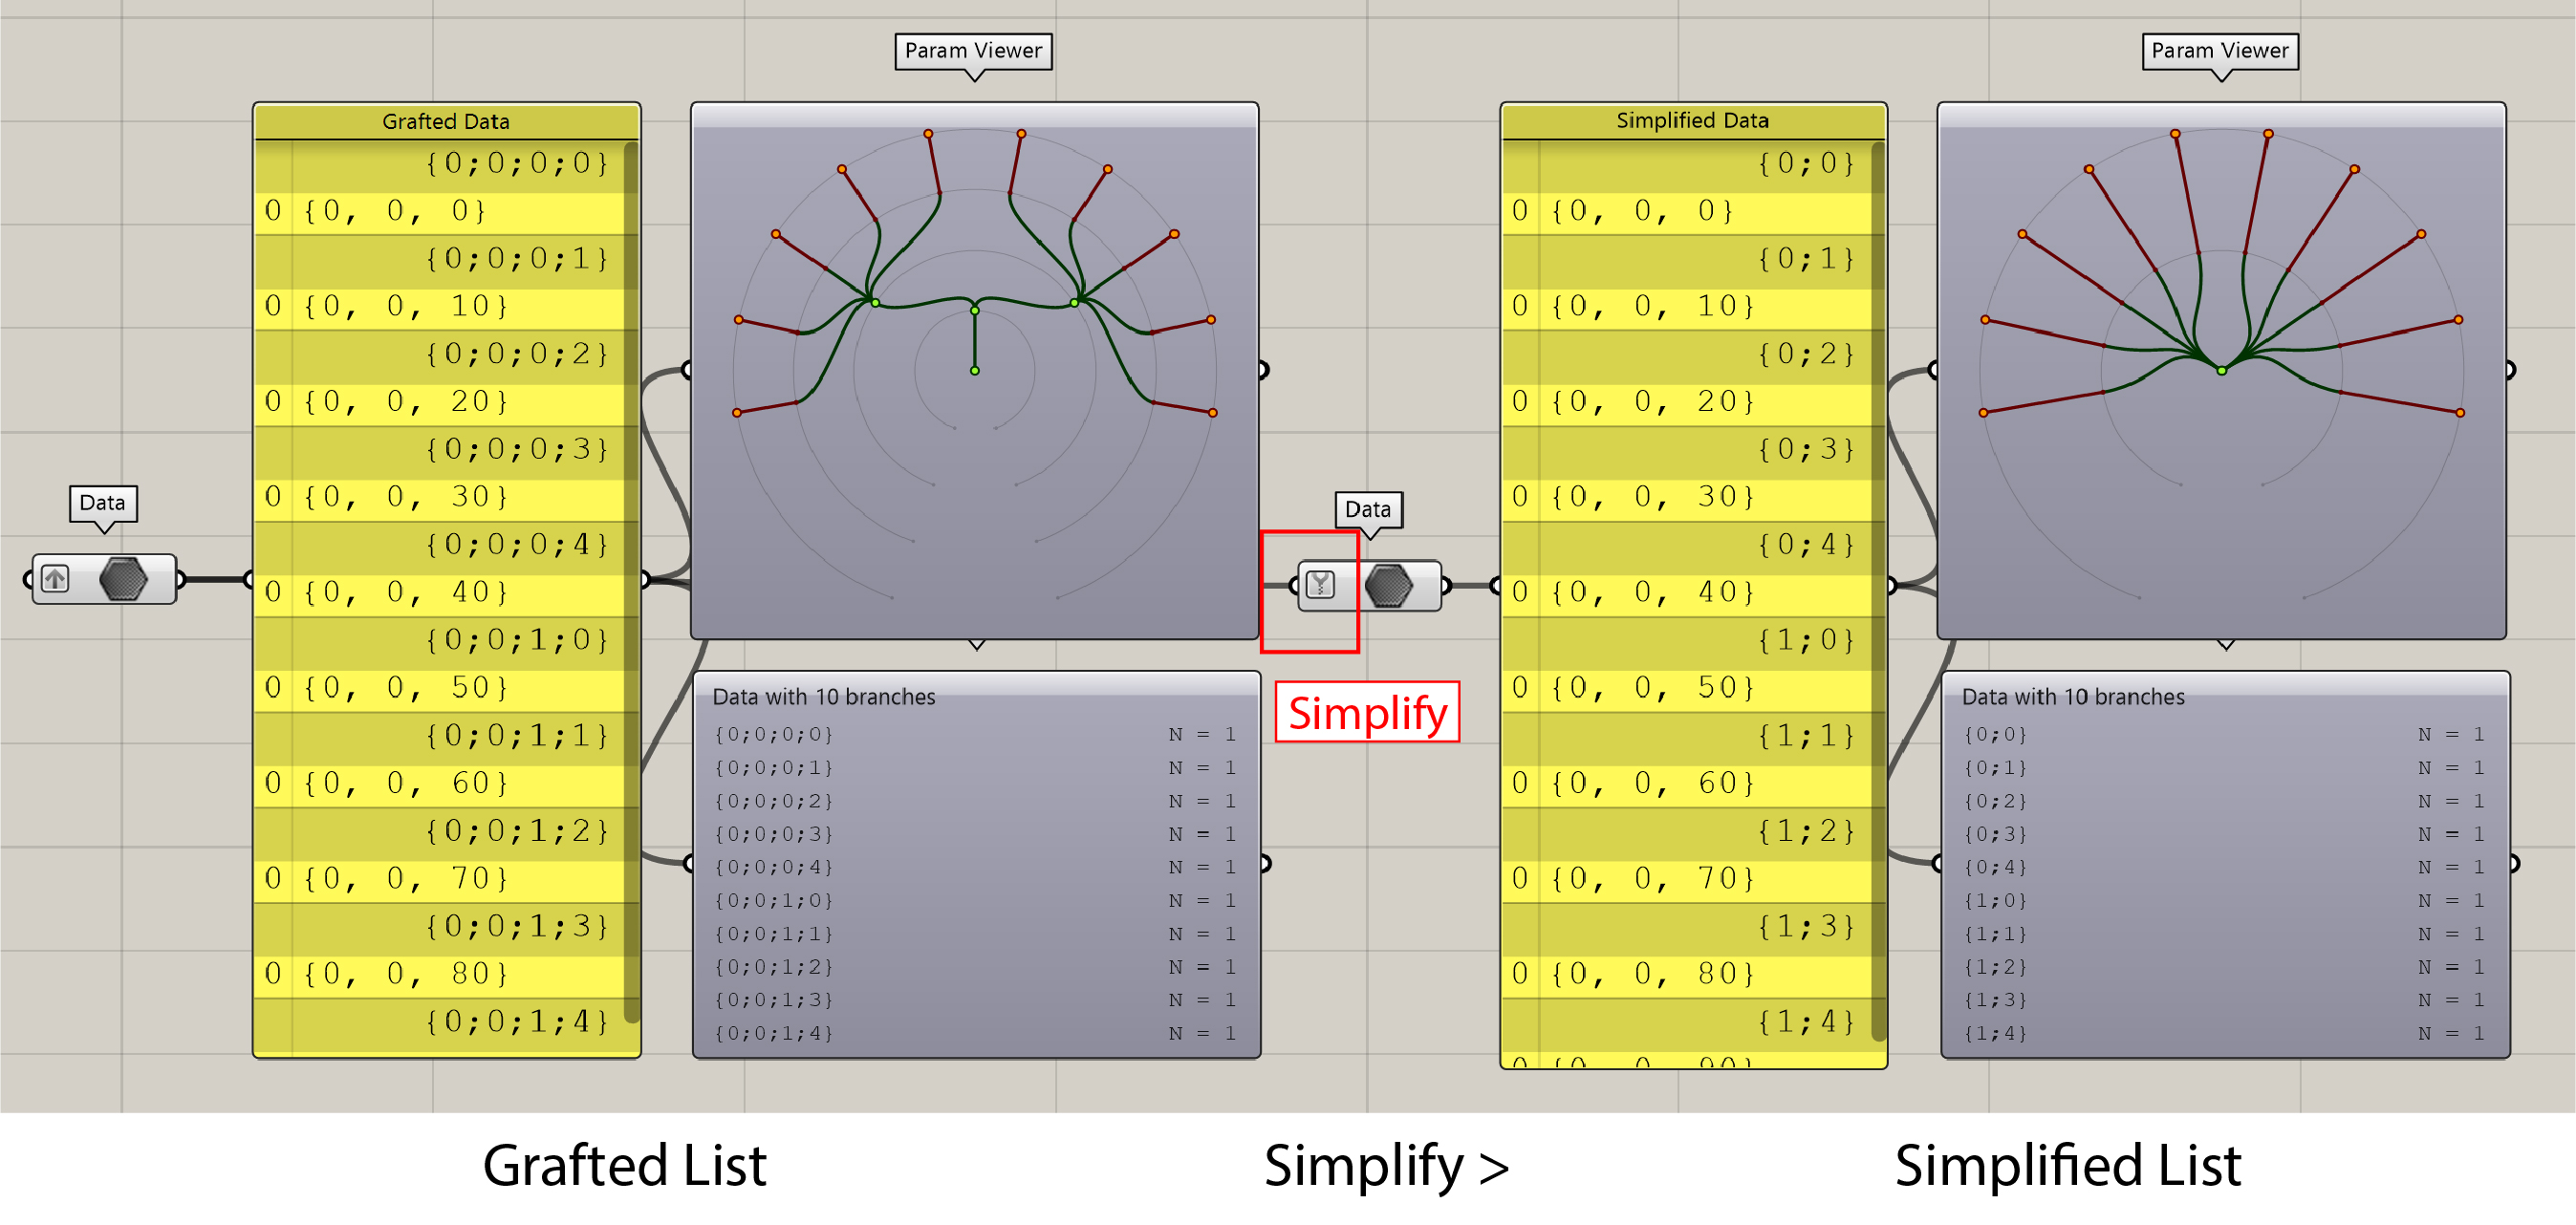
In this example,
Simplifytargets and removes the redundant segments — specifically the first two levels — of the branches. Consequently, what was once labeled as{0;0;0;1}is now succinctly identified as{0;1}. It is worth noting that theSimplify Treecomponent serves the same functionality.
Suirify
Suirify is a new component only available in Rhino 7. It can be seemed as an extreme version of simplifify. The component is located in Params > Util > Suirify, not in the IO of the component.
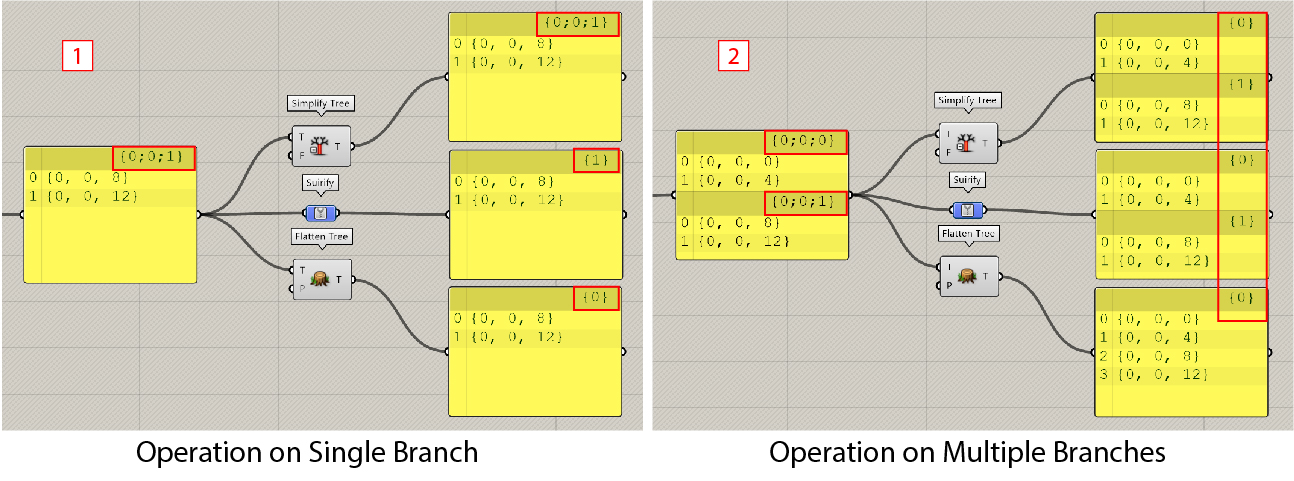
- When operating on single-branch data, such as
{0;0;1},suirifymodifies the branch index to be the simplest, which is{1}in the example. In contrast,simplifyretains the original branch index{0;0;1}. This particular property, while not common in use, is beneficial in complex scenarios of data matching.- When dealing with data that has multiple branches, both
suirifyandsimplifyyield identical results. Notice that whatever the data structure is,flattenalways modifies the branch index to be{0}, meaning the original data structure is not maintained.
Expression
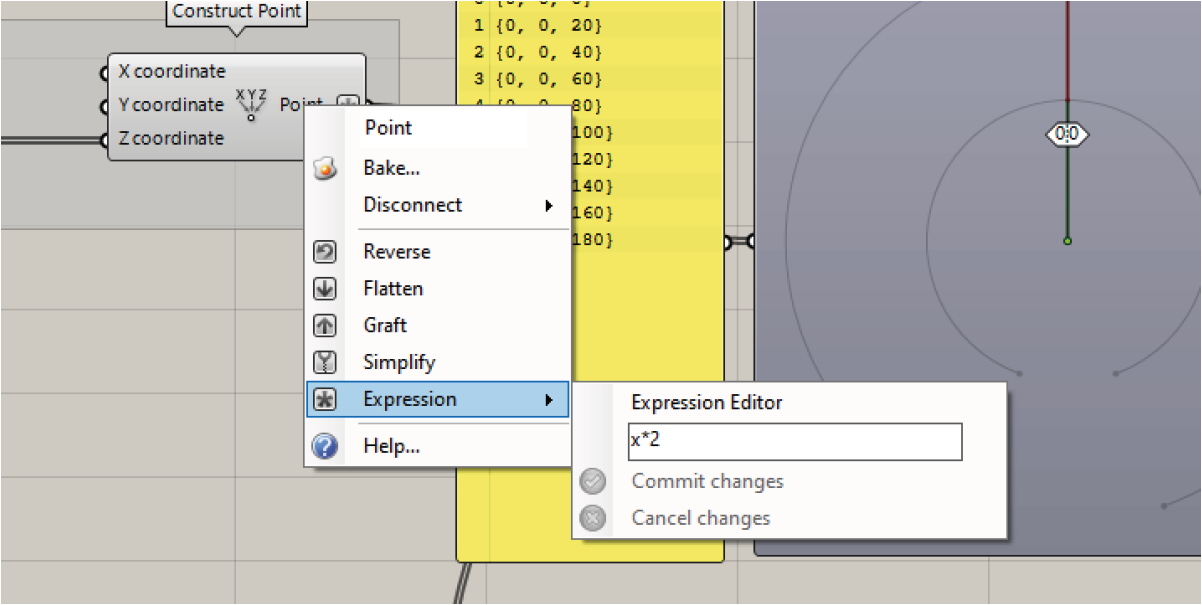
The expression option allows you to manipulate the data with a mathimatical expression. In the given example, utilizing the expression
x*2will scale the data by a factor of two. Alternatively, you can use theExpressioncomponent to get the same result, which is a little bit more user-friendly.

